|
|
1 year ago | |
|---|---|---|
| .. | ||
| lib | 1 year ago | |
| tools | 1 year ago | |
| .signature.p7s | 1 year ago | |
| LICENSE.txt | 1 year ago | |
| README.md | 1 year ago | |
| Syncfusion.SfChart.WPF.26.2.7.nupkg | 1 year ago | |
| syncfusion_logo.png | 1 year ago | |
README.md
Syncfusion WPF Chart components
This package contains WPF Chart, WPF Range Selector, WPF Sparkline, and WPF Surface Chart, components for WPF application.
System Requirements
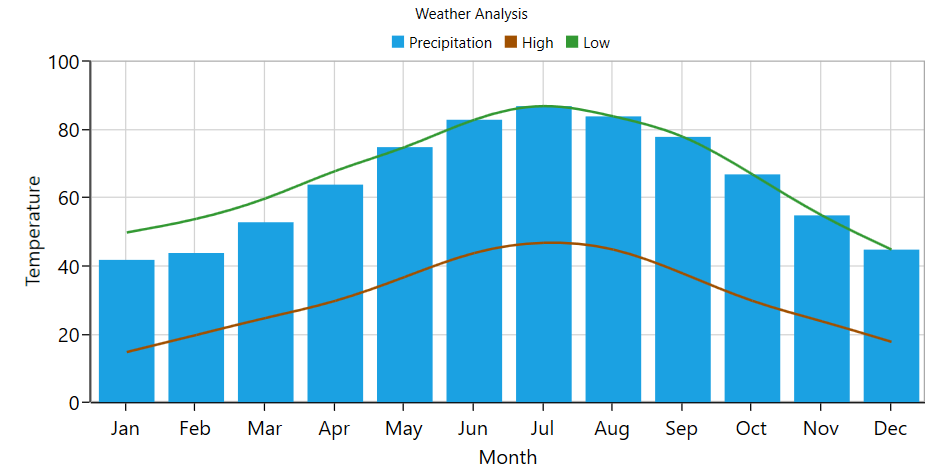
WPF Chart
The WPF Chart component is optimized to visualize a large amount of data in an elegant way. Its rich feature set includes functionalities like data binding, multiple axes, legends, animations, data labels, annotations, trackballs, tooltips, gradients, technical indicators, and zooming.
Features Overview | Docs | Online Demo | Support | Forums | Feedback
Getting Started
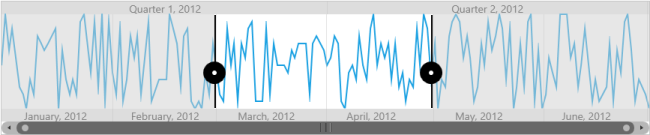
WPF Range Selector
The WPF Range Selector component provides an effective interface for selecting a smaller range from a large collection. It is commonly used in financial dashboards to filter the time range for which the data is visualized. The interface is also optimized for touch.
Features Overview | Docs | Online Demo | Support | Forums | Feedback
Getting Started
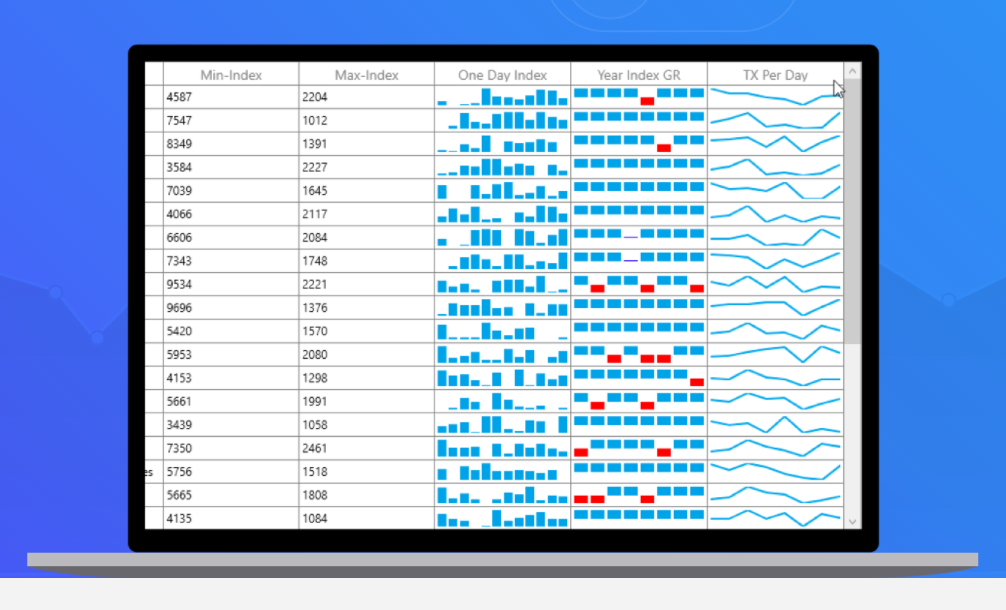
WPF Sparkline
The WPF Sparkline component is a tiny chart that helps present trends and variations associated with a measurement, such as average temperature or stock market activity, in a simple, lightweight, and condensed manner.
Features Overview | Docs | Online Demo | Support | Forums | Feedback
Getting Started
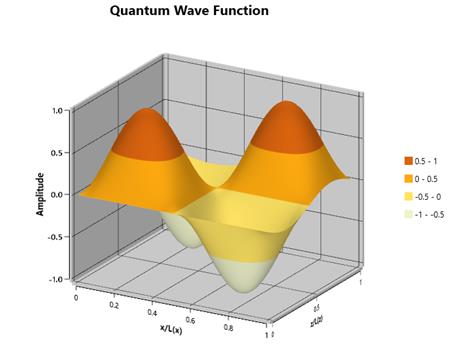
WPF Surface Chart
The WPF Surface Chart component is a high-performance, visually stunning, three-dimensional surface chart. It shows a three-dimensional surface that connects a set of data points.
Features Overview | Docs | Online Demo | Support | Forums | Feedback
Getting Started
License
This is a commercial product and requires a paid license for possession or use. Syncfusion’s licensed software, including this component, is subject to the terms and conditions of Syncfusion's EULA. You can purchase a license here or start a free 30-day trial here.
About Syncfusion
Founded in 2001 and headquartered in Research Triangle Park, N.C., Syncfusion has more than 27,000+ customers and more than 1 million users, including large financial institutions, Fortune 500 companies, and global IT consultancies.
Today, we provide 1700+ components and frameworks for web (Blazor, Flutter, ASP.NET Core, ASP.NET MVC, ASP.NET Web Forms, JavaScript, Angular, React, Vue, and jQuery), mobile (.NET MAUI, Flutter, Xamarin, UWP, and JavaScript), and desktop development (WinForms, WPF, WinUI, .NET MAUI, Flutter, Xamarin, and UWP). We provide ready-to-deploy enterprise software for dashboards, reports, data integration, and big data processing. Many customers have saved millions in licensing fees by deploying our software.
sales@syncfusion.com | www.syncfusion.com | Toll Free: 1-888-9 DOTNET